Note
Click here to download the full example code
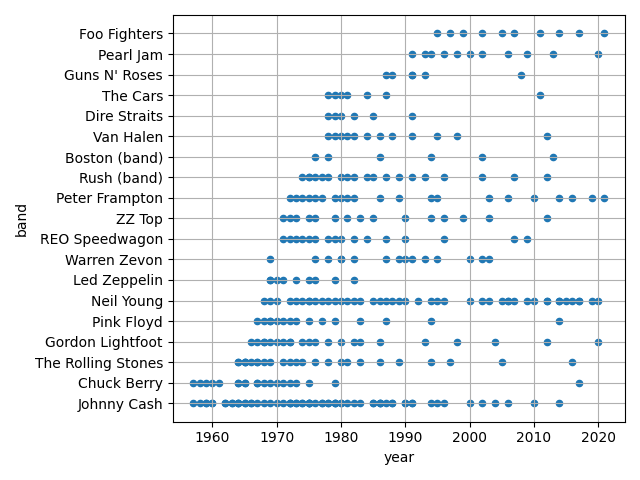
Music Timeline
Album release years of various rock et al. bands.
import requests
import bs4
import pandas as pd
import matplotlib.pyplot as plt
import re


def fetch_discography(band_name):
    url = 'https://en.wikipedia.org/wiki/' + band_name.replace(' ', '_')
    response = requests.get(url)
    doc = bs4.BeautifulSoup(response.content)
    section = doc.find(attrs={'id': 'Discography'})
    items = section.find_next('ul').find_all('li')
    regex = r'(?P<title>.*) \((?P<year>\d{4})(, live)?\)'
    matches = [re.search(regex, item.text) for item in items]
    data = pd.DataFrame({
        'band': band_name,
        'album': [match.group('title') for match in matches],
        'year': [int(match.group('year')) for match in matches],
    })
    return data


band_list = [
    'Led Zeppelin', 'Warren Zevon', 'The Rolling Stones', 'Boston (band)',
    'Johnny Cash', 'Neil Young', 'Van Halen', 'Dire Straits', 'Peter Frampton',
    'Gordon Lightfoot', 'Foo Fighters', 'Pearl Jam', 'Pink Floyd', 'The Cars',
    'Rush (band)', 'Chuck Berry', 'ZZ Top', "Guns N' Roses", 'REO Speedwagon',
]
df = pd.concat(map(fetch_discography, band_list))
df['band'] = df['band'].astype('category')
first_year = df.groupby('band')['year'].min()
df['key'] = [first_year[band] for band in df['band']]
df = df.sort_values('key')
df.plot.scatter('year', 'band')
plt.grid()
plt.tight_layout()
Total running time of the script: ( 0 minutes 9.817 seconds)