Daily EIA Data
I found an EIA tool that reported the daily net generation breakdown for the lower 48. I didn’t check if its API endpoint is documented anywhere (who needs documentation when web browsers come with built-in developer tools?) but it’s pretty straightforward and I played around with the data a bit. Its monthly sums more or less match the generation numbers in Table 7.2b (see this page), although there are some small differences, maybe because of excluding Hawaii and Alaska? Unfortunately it doesn’t seem to report any data prior to 2018-07-01.
Grab the entire dataset:
import requests
import pandas as pd
import matplotlib.pyplot as plt


def fetch(st, ed):
    url_template = 'https://www.eia.gov/electricity/930-api/region_data_by_fuel_type/series_data?type[0]=NG&respondent[0]=US48&start={st} 04:00:00&end={ed} 04:00:00&frequency=daily&timezone=Eastern'
    st = pd.to_datetime(st).strftime('%m%d%Y')
    ed = pd.to_datetime(ed).strftime('%m%d%Y')
    url = url_template.format(st=st, ed=ed)
    response = requests.get(url)
    json = response.json()
    df = pd.DataFrame(json[0]['data'])
    data = {}
    for i, row in df.iterrows():
        data[row['FUEL_TYPE_NAME']] = pd.Series(data=row['VALUES']['DATA'],
                                                index=row['VALUES']['DATES'])

    out = pd.DataFrame(data)
    out.index = pd.to_datetime(out.index)
    out = out[out.median().sort_values(ascending=False).index]
    return out
%%time
df = fetch('2018-07-01', '2021-08-10')  # no data from this API before 2018-07-01
CPU times: user 91 ms, sys: 7.89 ms, total: 98.9 ms
Wall time: 1.62 s
Nice and speedy, good job EIA!
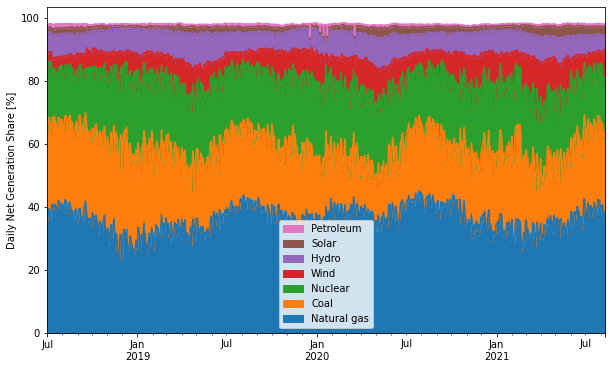
First up, a look at the daily generation share for each major energy source:
shares = df.divide(df.sum(axis=1), axis=0) * 100
shares = shares.drop(columns=['Other'])  # not interesting
ax = shares.plot.area(figsize=(10, 6))
ax.set_ylabel('Daily Net Generation Share [%]')
# reverse the legend entry order
handles, labels = ax.get_legend_handles_labels()
ax.legend(handles[::-1], labels[::-1]);
The same, but split out instead of stacked. This view shows more detail for the smaller generation sources.
fig, axes = plt.subplots(len(shares.columns), 1, sharex=True, figsize=(9, 9))

for source, ax in zip(shares.columns, axes):
    shares[source].plot(ax=ax)
    ax.set_xlabel(None)
    ax.set_ylabel(source)
    ax.set_title(None)

fig.suptitle('Daily Net Generation Share [%]')
fig.tight_layout()
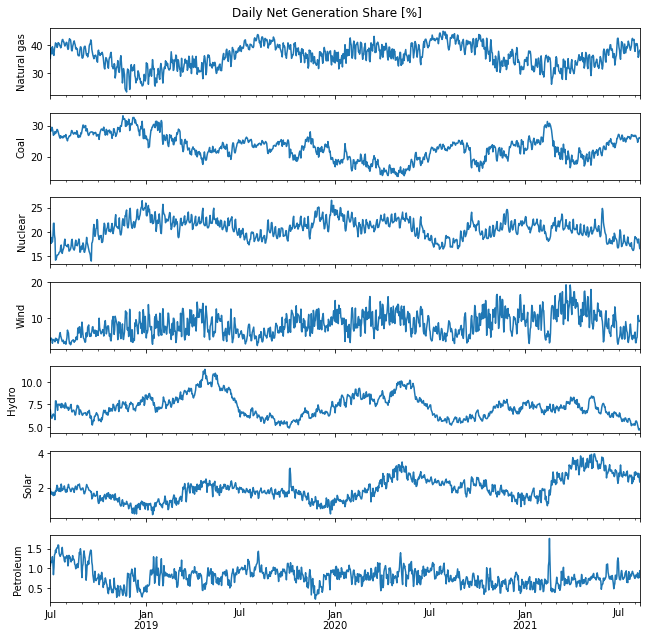
Some things I notice:
What’s up with the solar spike in October 2019? Smells like a data error to me…
Big petroleum spike in Feb 2021 maybe linked with the winter storms in Texas?
I wonder if hydro is ramping down because of drought? Or maybe it’s just the same summer/fall trough seen in previous years
Lots more day-to-day variation in wind than in solar
Nuclear seems to have a small periodic signal riding on top of the long-term variation. In fact some of the others do too. It’s not very easy to see on top of the longer-term variation, so here’s a quick normalization by 7-d average. Also switching from daily share to daily generation:
def norm_7d(signal):
    signal_7d_avg = signal.resample('7d').mean()
    signal_7d_avg_ff = signal_7d_avg.reindex(signal.index, method='ffill')
    signal_norm = signal / signal_7d_avg_ff
    df_signal = signal_norm.to_frame().assign(dow=signal.index.dayofweek)
    return df_signal
fig, axes = plt.subplots(3, 3, figsize=(10, 10), sharey=True)
axes = axes.ravel()

for source, ax in zip(df.columns, axes):
    df_share = norm_7d(df[source])
    df_share.boxplot(by='dow', notch=True, ax=ax, showfliers=False)
    ax.set_xlabel(None)
    ax.set_title(source)
    ax.set_xticklabels(['Mon', 'Tue', 'Wed', 'Thu', 'Fri', 'Sat', 'Sun'])

fig.tight_layout()
axes[3].set_ylabel('Daily Generation, Normalized by Weekly Average')
fig.suptitle(None);
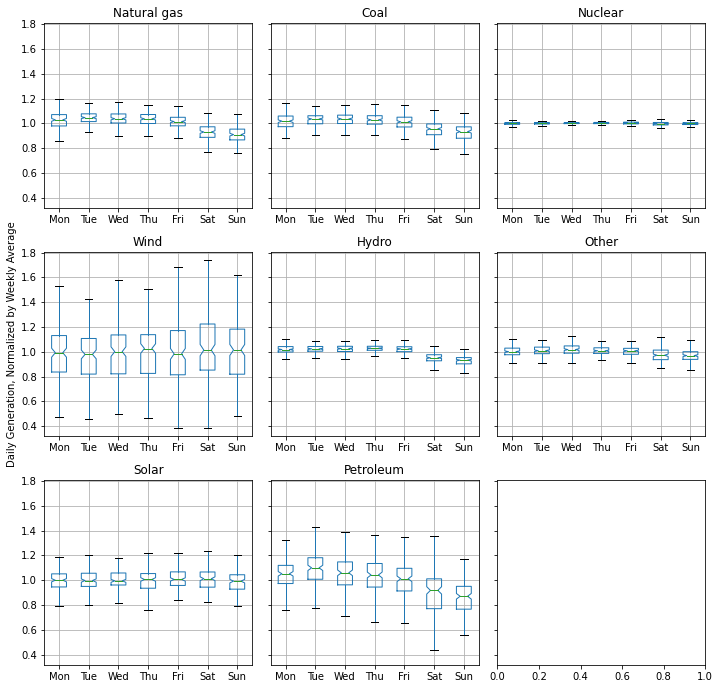
Sources with no significant weekly cycle: nuclear, wind, solar
Sources that produce less on weekends: natural gas, coal, hydro, petroleum
Is it as simple as which sources are dispatchable and which aren’t? Maybe. Am I so ignorant that I don’t understand even the basic dynamics of our electrical market? Definitely. It’s still fun to play with the data though.