Note
Click here to download the full example code
Zenith Refraction Variation
How do temperature and pressure affect atmospheric refraction?
Atmospheric refraction distorts the sun’s apparent position when the sun is low in the sky. The Solar Position Algorithm 1 includes adjustments for pressure and temperature.
from pvlib.solarposition import get_solarposition
import matplotlib.pyplot as plt
import numpy as np
import pandas as pd
lat, lon = 40, -80
times = pd.date_range('2019-06-01 04:50', '2019-06-01 05:00',
freq='1s', tz='Etc/GMT+5')
temperature_range = np.arange(-20, 21, 10).astype(int) # degrees C
pressure_range = np.arange(0, 126e3, 25e3).astype(int) # Pascals
def get_zenith(p, t):
solar_position = get_solarposition(times, lat, lon,
pressure=p, temperature=t)
return solar_position.apparent_zenith
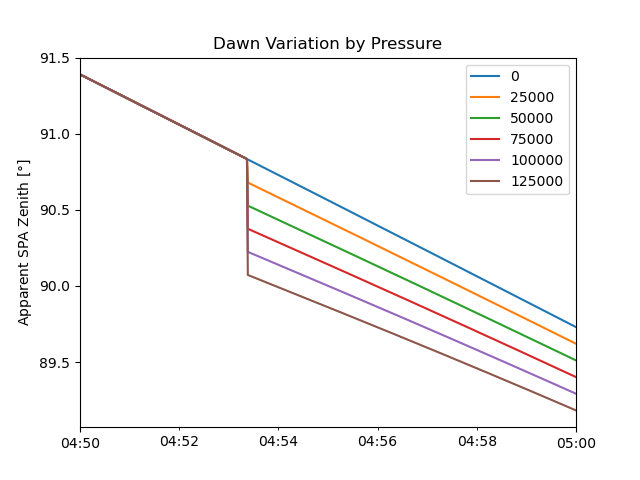
df_pressure = pd.DataFrame({
p: get_zenith(p, 12) for p in pressure_range
})
df_pressure.plot()
plt.ylabel(r'Apparent SPA Zenith [$\degree$]')
plt.title('Dawn Variation by Pressure')
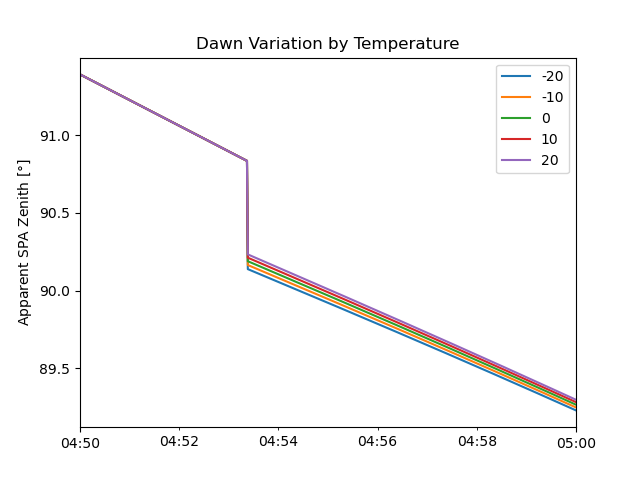
df_temperature = pd.DataFrame({
t: get_zenith(101325, t) for t in temperature_range
})
df_temperature.plot()
plt.ylabel(r'Apparent SPA Zenith [$\degree$]')
plt.title('Dawn Variation by Temperature')
plt.show()
def signed_max(s):
a = s.abs()
return a.max() * np.sign(s[a.idxmax()])
baseline = get_zenith(0, 0)
temperature_range = np.arange(-65, 66, 5).astype(int) # degrees C
pressure_range = np.arange(0, 126e3, 5e3).astype(int) # Pascals
max_errors = pd.DataFrame([
{'pressure': p,
'temperature': t,
'max_error': signed_max(get_zenith(p, t) - baseline)}
for p in pressure_range
for t in temperature_range
])
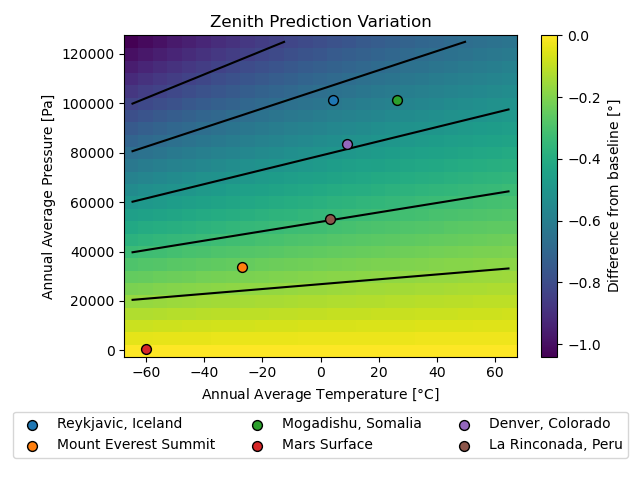
piv = max_errors.pivot('pressure', 'temperature', 'max_error')
plt.figure()
plt.pcolormesh(piv.columns, piv.index, piv, shading='auto')
plt.colorbar().set_label(r'Difference from baseline [$\degree$]')
plt.contour(piv.columns, piv.index, piv,
levels=[-0.83, -0.67, -0.5, -0.33, -0.17],
colors='k', linestyles='solid')
reference_points = {
'Reykjavic, Iceland': (4.3, 101325),
'Mount Everest Summit': (-27, 33.7e3),
'Mogadishu, Somalia': (26.4, 101325),
'Mars Surface': (-60, 600),
'Denver, Colorado': (9, 83503),
'La Rinconada, Peru': (3.1, 53302),
}
for name, (t, p) in reference_points.items():
plt.scatter(t, p, label=name, edgecolor='k', s=50, zorder=3)
plt.legend(loc='upper center', ncol=3, bbox_to_anchor=(0.5, -0.15))
plt.xlabel(r'Annual Average Temperature [$\degree$C]')
plt.ylabel('Annual Average Pressure [Pa]')
plt.title('Zenith Prediction Variation')
plt.tight_layout()
plt.show()
References
- 1
I Reda and A Andreas, Solar Position Algorithm for Solar Radiation Applications (Revised), Technical Report NREL/TP-560-34302, National Renewable Energy Laboratory, 2008. doi: https://doi.org/10.2172/15003974
Total running time of the script: ( 0 minutes 20.180 seconds)