Note
Click here to download the full example code
CEC Over Time
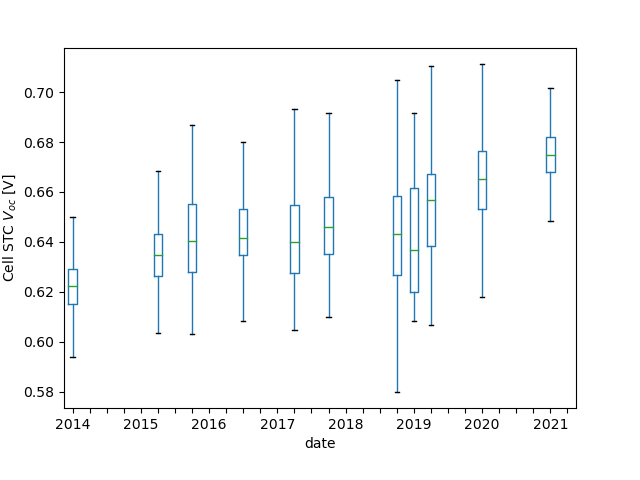
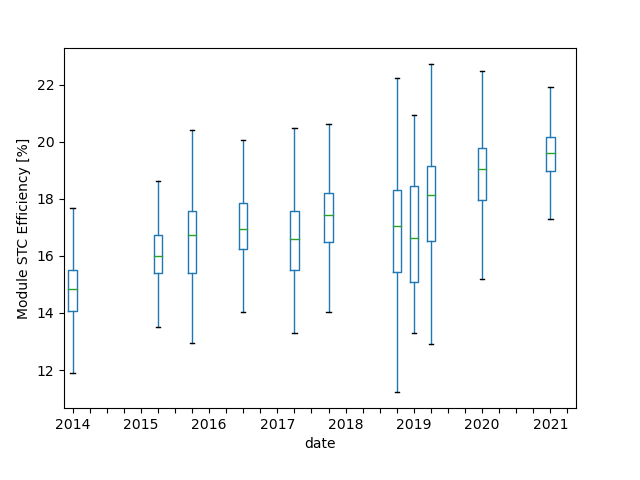
A rough view of how the efficiency and Voc of Mono-Si PV modules on the market have evolved over time.
import pandas as pd
import matplotlib.pyplot as plt
import subprocess
import urllib
Find one SAM commit hash for each calendar quarter:
cmd = ["git", "log", "--pretty=%H %cI"]
SAM_dir = '/home/kevin/projects/SAM'
result = subprocess.run(cmd, capture_output=True, cwd=SAM_dir)
values = [line.split() for line in result.stdout.decode().strip().split('\n')]
all_commits = pd.DataFrame(values, columns=['hash', 'date'])
# not sure why but I only get a proper datetime index when I drop the times
all_commits['date'] = pd.to_datetime(all_commits['date'].str.split('T').str[0])
all_commits = all_commits.set_index('date')
quarterly_commits = all_commits.resample('QS').first()
# the early commits don't have any useful info
quarterly_commits = quarterly_commits.loc['2014':]
Fetch historical CEC module db files from SAM’s GitHub:
url_template = 'https://raw.githubusercontent.com/NREL/SAM/{longhash}/deploy/libraries/CEC%20Modules.csv'

df = pd.DataFrame({'Name': []})
for date, longhash in quarterly_commits['hash'].items():
    url = url_template.format(longhash=longhash)
    try:
        aux = pd.read_csv(url)
    except urllib.error.HTTPError:
        pass
    aux = aux.drop(index=[0, 1])
    aux['date'] = date
    # only store new mods -- not perfect because some mods change names between
    # versions, but a simple filter should mostly work...?
    previously_seen_modules = set(df['Name'])
    aux = aux.loc[aux['Technology'] == 'Mono-c-Si', :]
    aux = aux.loc[~aux['Name'].isin(previously_seen_modules), :]
    if aux.empty:
        # need a dummy entry so the quarter is still represented
        aux = pd.DataFrame({'date': [date]})
    df = df.append(aux)  # inefficient but whatever


numerics = ['V_oc_ref', 'N_s', 'V_mp_ref', 'I_mp_ref', 'A_c']
df[numerics] = df[numerics].astype(float)
Plots
def plot(y, ylabel):
    df.boxplot(y, by='date', showfliers=False, grid=False)
    ticks, labels = plt.xticks()
    labels = [tl.get_text().rsplit('-', 1)[0] for tl in labels]
    labels = [tl.split('-')[0] if tl.endswith('-01') else '' for tl in labels]
    plt.xticks(ticks=ticks, labels=labels)
    plt.suptitle('')
    plt.title('')
    plt.ylabel(ylabel)


df['Voc_per_cell'] = df['V_oc_ref'] / df['N_s']
plot('Voc_per_cell', 'Cell STC $V_{oc}$ [V]')
# Pstc column doesn't exist in old files so calculate from Vmp*Imp instead
df['P_per_area'] = 100 * df['V_mp_ref'] * df['I_mp_ref'] / df['A_c'] / 1000
plot('P_per_area', 'Module STC Efficiency [%]')
Total running time of the script: ( 0 minutes 40.886 seconds)