Note
Click here to download the full example code
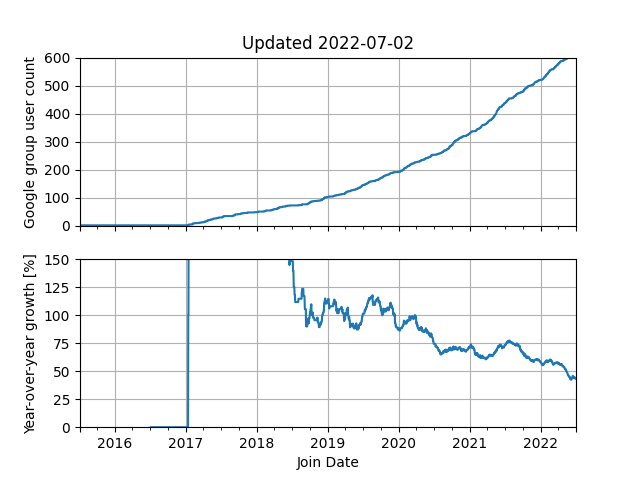
pvlib Google Group
Count of members in the pvlib google group over time.
Note: this excludes people that were once in the group but have since left it, i.e. it represents the join date history of the current group members.
import pandas as pd
import matplotlib.pyplot as plt

df = pd.read_csv('../../data/pvlib_google_group.csv', parse_dates=['Join Date'])
s = df.set_index('Join Date').assign(n=1)['n'].cumsum().resample('d').max().ffill()

fig, axes = plt.subplots(2, 1, sharex=True)

s.plot(ax=axes[0])
axes[0].set_ylabel('Google group user count')
axes[0].set_ylim(0, 600)
axes[0].grid()

growth = 100 * (s - s.shift(365)) / s.shift(365)
growth.plot(ax=axes[1])
axes[1].set_ylabel('Year-over-year growth [%]')
axes[1].set_ylim(0, 150)
axes[1].grid()

axes[0].set_title(f"Updated {df['Join Date'].max().strftime('%Y-%m-%d')}")
plt.show()
for milestone in [100, 500]:
    idx = s.index[s >= milestone][0]
    print(milestone, idx.date())
Out:
100 2018-12-17
500 2021-11-08
Total running time of the script: ( 0 minutes 0.939 seconds)