Note
Click here to download the full example code
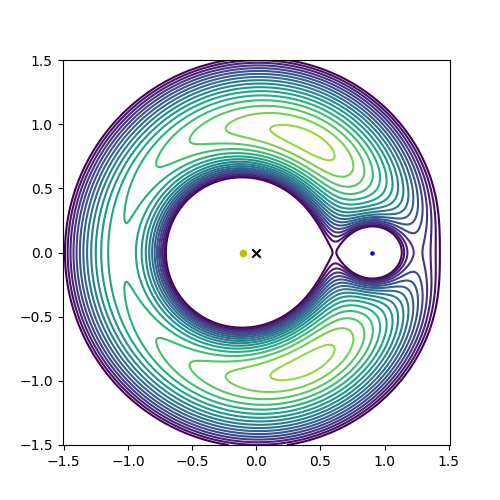
Lagrange Points
Recreating Dr. Drang’s Lagrange point diagram: https://leancrew.com/all-this/2016/08/lagrange-points-redux/
Out:
(-1.5, 1.5, -1.5, 1.5)
import numpy as np
import matplotlib.pyplot as plt

mu = 0.1
R = 1
sun_pos = np.array([-mu*R, 0])
earth_pos = np.array([(1-mu)*R, 0])

N = 1000
x, y = np.meshgrid(np.linspace(-1.5, 1.5, N), np.linspace(-1.5, 1.5, N))

term1 = -(1-mu) / ((x + mu)**2 + y**2)**0.5
term2 = -mu / ((x - (1-mu))**2 + y**2)**0.5
term3 = -0.5 * (x**2 + y**2)

u = term1 + term2 + term3

plt.figure(figsize=(5, 5))
levels = np.linspace(-1.8, -1.4, 20)
plt.contour(x, y, u, levels=levels)
plt.scatter([sun_pos[0]], [sun_pos[1]], c='y', s=20)
plt.scatter([earth_pos[0]], [earth_pos[1]], c='b', s=5)
plt.scatter([0], [0], c='k', marker='x')
plt.axis('equal')
Total running time of the script: ( 0 minutes 0.540 seconds)